How to Choose the Right Pneumatic Conveyor?
Choosing the right Pneumatic Conveyor begins with the material, not the catalog. Fine flour behaves differently from plastic pellets. A system that handles one smoothly may plug, degrade, or create excess dust with another. Small details matter.
David Mills, author of Pneumatic Conveying Design Guide, is a recognized specialist in conveying-system design. A practical paraphrase of his design approach is: “Match the conveying method to the material and operating conditions.” This is a paraphrase, not a verbatim quotation. It captures an important point: reliable selection depends on measured properties, not assumptions.
Start by recording particle size, bulk density, moisture, abrasiveness, and fragility. Then define the required throughput, route length, number of bends, and pickup and discharge points. A 30-meter line with several elbows presents different challenges from a short, straight transfer. These details influence whether dilute-phase or dense-phase conveying is more suitable, and how much air and pressure the system needs.
This guide explains the main system types, key design factors, and questions to ask suppliers. It also considers maintenance access, filtration, energy use, and future capacity. No single conveyor suits every plant. Even a careful estimate can miss a material’s tendency to bridge or separate, so representative testing may be worthwhile. Ask for the assumptions behind performance figures, and compare them against real operating conditions. A little skepticism helps. The right choice is the one that moves your material consistently, safely, and economically—not simply the one with the highest advertised capacity.
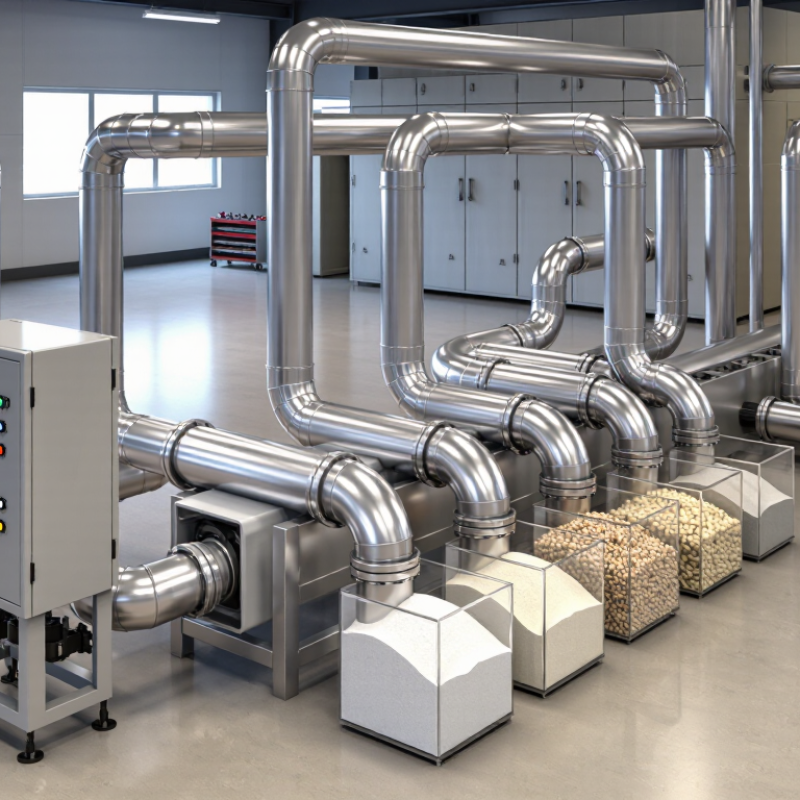
Define the Material and Conveying Requirements
Start with the material, not the equipment catalogue. Collect a representative sample and record particle size, bulk density, moisture, temperature, abrasiveness, and friability. Note whether the product cakes, segregates, or breaks under impact. Small details matter. A dry sample from the lab may behave differently on a humid production floor. Ask operators about seasonal changes and batch variation; these are easy to overlook.
Next, define the conveying duty: target throughput in kilograms per hour, route length, vertical lift, bends, operating hours, and available space. The U.S. Department of Energy’s 2016 report, Improving Compressed Air System Performance: A Sourcebook for Industry, says compressed-air systems use about 10% of electricity in U.S. manufacturing, rising to 30% at some facilities. This is a plant-wide benchmark, not a conveyor-specific estimate, but it shows why air demand deserves attention. Use actual material in conveying trials where possible. Confirm that the proposed rate avoids plugging, excessive product damage, and unstable flow. Be cautious with early estimates; moisture and pipe layout can change the result.
Compare Dilute-Phase and Dense-Phase Systems
Choosing between dilute-phase and dense-phase conveying starts with the material, not the pipe. Dilute-phase systems suspend particles in fast-moving air, making them practical for longer routes and flexible layouts. Mills’ Pneumatic Conveying Design Guide gives typical conveying velocities of roughly 15–30 m/s for dilute phase and 3–10 m/s for dense phase; actual values depend on material and system design. At higher speeds, fragile granules may chip, and bends can become wear points. Check particle size, bulk density, moisture, and how much breakage the product can tolerate.
Dense phase moves material in slower, more concentrated plugs or dunes. It can reduce particle damage and air demand, but needs careful pressure control and a feeder suited to the material. A damp, cohesive powder may not flow reliably just because the conveying speed is low.
Not a perfect rule.
For a test, measure throughput, pressure, product damage, and residue after conveying. Keep the test route representative, including its bends and vertical lift. Compare the results with the planned operating hours and cleaning needs. A short trial can reveal what a spreadsheet misses. For design context, consult Mills’ guide alongside material-specific conveying tests; published velocity ranges are starting points, not guarantees.
Select the Conveying Route and Equipment Configuration
A pneumatic conveyor should be designed around the material’s journey, not just the distance between two machines. Map each transfer point, elevation change, and required delivery rate. A route with fewer bends is often easier to operate, but a straight line is not always practical. Check whether pipes can be inspected and cleared without moving nearby equipment. Small access details matter.
Material behavior guides the conveying method. Fine, free-flowing powder may suit dilute-phase transport, while fragile or abrasive particles may need gentler handling. Dense-phase systems can reduce particle speed, but they require careful matching of pressure, feed rate, and pipe layout. Test the material when possible. A sample that pours neatly into a container may still bridge in a hopper or separate during conveying.
Configure the feeder, blower or compressor, receiver, filters, and controls as one system. Size the air source for the full route, including vertical lifts and bends, rather than relying on a simple distance estimate. Allow space for filter changes and safe access to valves. Instrument readings can reveal pressure loss or unstable feeding, though they do not explain every problem. Real plants are rarely perfect; leave room to adjust the layout after observing actual operation.
Size the Pipeline and Specify Airflow Requirements
Sizing a pneumatic conveyor starts with the material, not the pipe catalog. Record the required mass flow, particle size, bulk density, moisture, and whether the product breaks easily. Then map the route, including elbows, vertical lifts, and the receiving vessel. These details affect pressure loss and the airflow needed to keep solids moving. There is no magic diameter. An undersized line can raise pressure loss and wear; an oversized one may need more air than the process requires. Specify airflow at stated reference conditions, plus conveying pressure at the pickup point. “Actual” and “standard” flow are not interchangeable.
Use a conveying calculation based on the material and route, then verify it with operating data or a representative trial. Track pressure at the blower and receiver, product rate, and signs of settling at bends. The U.S. Department of Energy’s Improving Compressed Air System Performance: A Sourcebook for Industry reports that compressed air systems account for about 10% of industrial electricity use. That figure is not a conveyor-sizing rule, but it shows why excess airflow deserves attention. A calculation can still miss changes in moisture or feed consistency. Check those assumptions before locking in the pipeline and airflow specification.
How to Choose the Right Pneumatic Conveyor: Pipeline Size and Airflow
This chart shows the theoretical airflow needed to maintain an air velocity of 20 m/s in pipes of different internal diameters. Actual system requirements depend on the material, solids loading, pressure drop, bends, and elevation changes.