

Choosing the right edge stress meter begins with understanding what the glass edge actually experiences. A polished edge may look flawless under bright factory lighting, yet hidden tensile stress can remain near the bevel. That stress may trigger cracks during cutting, handling, transport, or installation. The correct instrument helps reveal this risk before failure becomes expensive.
Dr. James E. Shelby, a respected glass scientist, offers a useful principle: “Glass strength depends less on its ideal structure than on the flaws carried by its surface.” This idea matters when selecting an edge stress meter. The device should match the glass type, edge geometry, measurement range, and production environment. A laboratory instrument may provide excellent precision, but it may not survive dust, vibration, or repeated shop-floor use. Practical accuracy matters more than impressive specifications.
Look closely at the measurement method. Some systems assess birefringence, while others use optical analysis or specialized stress calculations. Check calibration procedures, operator training, software clarity, and support availability. Also examine how the meter handles curved edges, thin glass, coated surfaces, and irregular bevels. Small details matter. A device can produce numbers without producing confidence.
Do not choose by price alone. That shortcut often fails. Compare repeatability, traceability, inspection speed, and long-term maintenance costs. Test the edge stress meter on representative samples, including pieces with known defects. Even then, remain cautious. No instrument replaces sound process control, careful handling, and experienced interpretation. The best choice is the meter that turns uncertain edge conditions into dependable production decisions.
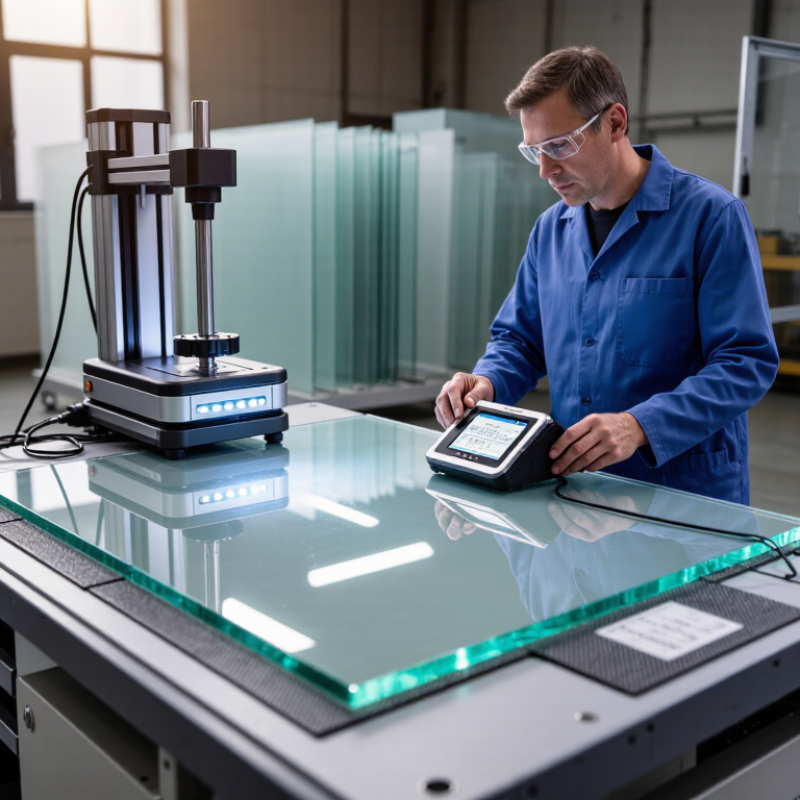
How to Choose the Right Edge Stress Meter?
Define Your Edge Stress Measurement Requirements
Choosing an edge stress meter begins with defining the measurement task, not comparing product features. Identify the material, edge shape, thickness, and expected stress range. A thin coated edge may require different sensitivity than a thick, polished component. Measure the real edge.
Decide whether you need development data, routine inspection, or process control. These goals affect resolution, repeatability, measurement speed, and data recording. Consider the smallest stress difference that could change your decision. If the expected range is unclear, test representative samples before purchasing equipment. This step often reveals uneven edges, surface contamination, or optical limitations. My experience is that clean samples alone can create unrealistic confidence. Real production samples matter more.
Tips: Keep the setup consistent. Control lighting, temperature, sample position, and operator pressure. Ask how the meter is calibrated, how often verification is required, and whether reference standards are available. Check the measurement uncertainty, not only the displayed resolution. A device showing fine decimals may still produce unstable results. Record several readings across one edge and compare their variation. Also review software exports, maintenance needs, and operator training. A technically advanced instrument can fail in practice when its workflow is slow or confusing. Test usability with the people who will operate it daily.
| Measurement Profile | Typical Application | Recommended Measurement Range | Minimum Resolution | Target Accuracy | Suitable Edge or Material | Sensor Configuration | Environmental Requirements | Useful Data Output | Selection Priority |
|---|---|---|---|---|---|---|---|---|---|
| Routine Incoming Inspection | Quick verification of edge stress on delivered glass or processed panels | 0–50 MPa | 0.1 MPa | ±2% of full scale | Flat glass edges and regularly shaped samples | Contact probe with a fixed measurement geometry | 18–28°C; clean, dry work area | Displayed value, measurement timestamp, operator ID | Simple operation and repeatability |
| Process Control | Monitoring stress after cutting, grinding, drilling, or edge finishing | 0–100 MPa | 0.1 MPa | ±1.5% of full scale | Glass, ceramic, or brittle sheet materials with machined edges | Guided probe with controlled contact force | 15–35°C; resistance to production dust is preferred | Trend records, pass/fail limits, USB or serial export | Fast sampling and consistent positioning |
| Low-Stress Research Measurement | Characterizing small stress differences during laboratory testing | 0–25 MPa | 0.01 MPa | ±1% of full scale | Thin glass, coated substrates, and carefully prepared test coupons | High-sensitivity probe with adjustable contact pressure | 20–25°C; vibration-controlled environment recommended | Raw readings, statistical summaries, calibration status | Resolution, stability, and low measurement noise |
| High-Stress Failure Analysis | Investigating edge damage, cracks, breakage, or abnormal finishing conditions | 0–200 MPa | 0.5 MPa | ±2% of full scale | Thick glass and heavily processed or visibly damaged edges | Interchangeable probe tips with protective sample support | 10–40°C; robust housing and overload protection required | Peak value, location, operator notes, and complete test history | Wide range and mechanical protection |
| Portable Field Inspection | On-site checks where samples cannot be moved to a laboratory | 0–100 MPa | 0.1 MPa | ±2.5% of full scale | Flat or slightly irregular edges accessible in installed assemblies | Compact handheld probe with alignment guide | 5–40°C; battery operation and impact-resistant enclosure | Internal memory, date/time stamp, Bluetooth or USB transfer | Portability, battery life, and ease of alignment |
| Automated Production Monitoring | Continuous or periodic inspection integrated with a manufacturing line | 0–150 MPa | 0.1 MPa | ±1.5% of full scale | Consistent product geometry and repeatable edge positions | Fixed sensor assembly with automated positioning | 10–45°C; dust control and vibration compensation preferred | PLC connection, digital I/O, alarms, and database-compatible records | Integration, cycle time, and measurement repeatability |
| Multi-Material Evaluation | Comparing edge stress across different brittle or semi-brittle substrates | 0–100 MPa | 0.1 MPa | ±2% of full scale | Glass, ceramics, stone-like slabs, and coated sheet materials | Multiple contact geometries and adjustable sample fixtures | 15–35°C; material-specific calibration support is desirable | Material ID, probe ID, calibration factor, and comparative reports | Adaptable fixtures and documented calibration |
| Quality-System Compliance | Measurements that must be traceable for audits, corrective actions, or customer reports | Application-dependent; commonly 0–100 MPa | 0.1 MPa or better | Defined by the internal control plan | Production samples measured under a documented procedure | Calibratable probe with serial-number tracking | Controlled temperature and documented measurement conditions | Calibration reminders, user permissions, audit trail, and PDF/CSV reports | Traceability, verification records, and controlled procedures |